Machine Learning,
Made Visible.
A hands-on way to learn ml, experiment with models, mess with the parameters, and watch the results change in real time.
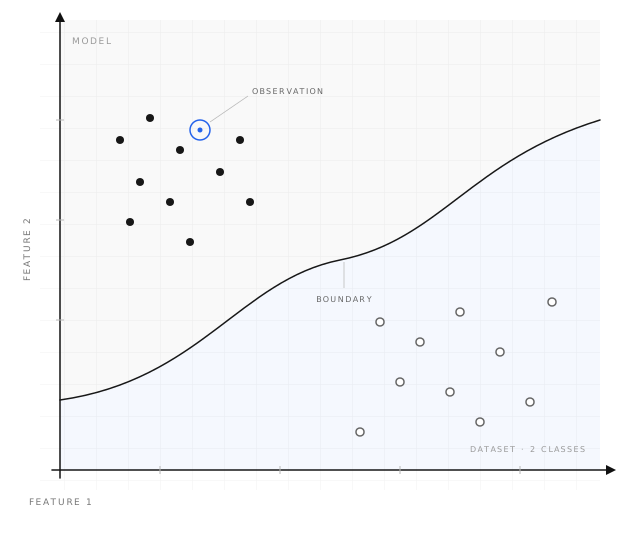
Live product preview
Open the visualizerConfluence / Logistic Regression
DECISION BOUNDARY · C = 1.0
● CLASS 0 ■ CLASS 1
Run summary
Example summary — open the visualizer to run it live and see your own numbers.
- ALGORITHM
- logistic-regression
- DATASET
- breast-cancer
- SAMPLES
- 300
- ACCURACY
- 0.92
- F1-SCORE
- 0.94
LEARNING CURVE
SCIKIT-LEARN · EXAMPLE PREVIEW · 300 ROWS
Features
Built for understanding.
Not another toy demo. Confluence runs real algorithms with real computation, wrapped in an interface designed for exploration.
01
Interactive visualization
See decision boundaries, loss curves, classifications, and model behavior update as you change hyperparameters.
02
Real data
Explore 25 real datasets — from Iris and Breast Cancer to Titanic and California Housing — instead of toy-only examples.
03
First-principles learning
Understand what each algorithm is actually optimizing, with theory, formulas, and visual intuition side by side.
04
Explanations
Turn model output into something readable: feature contributions, decision paths, and plain-language prediction breakdowns.
05
Algorithm comparison
Race algorithms on the same dataset, overlay their boundaries, and see exactly where — and why — they diverge.
06
Learning notes
Connect visual behavior with the math through a curated roadmap from linear algebra to model evaluation.
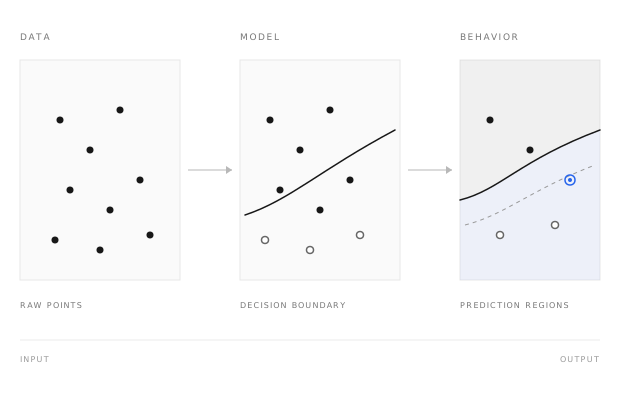
Data → Model → Behavior
Algorithms
Algorithms, without the black box.
Every model runs for real, server-side. Filter by family or search to find the one you want to take apart.
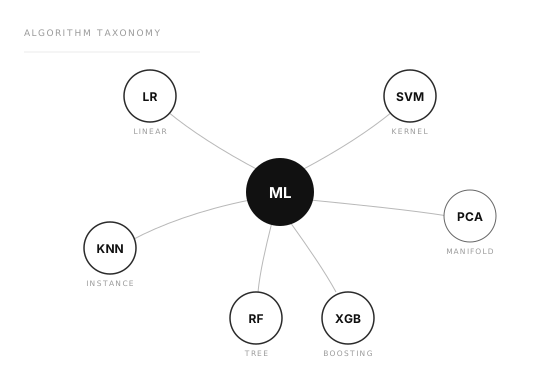
Showing 10 of 38
- 01Logistic RegressionLinear decision boundary via logistic function
- 02K-Nearest NeighborsClassification by majority vote of k nearest points
- 03Decision TreeAxis-aligned splits creating piecewise boundaries
- 04SVM (RBF Kernel)Maximum margin classifier with RBF kernel
- 05SVM (Linear)Linear maximum margin classifier
- 06SVM (Polynomial)SVM with polynomial kernel
- 07Random ForestEnsemble of decision trees with bagging
- 08Extra TreesExtremely randomized trees ensemble
- 09AdaBoostSequential ensemble focusing on hard examples
- 10Gradient BoostingSequential ensemble optimizing gradient
38 algorithms · 4 families
Browse the full encyclopediaDatasets
Real data.
Real behavior.
Every dataset ships with its full shape — rows, features, task, and target — so you know exactly what the model is learning from.
Explore datasets in the visualizer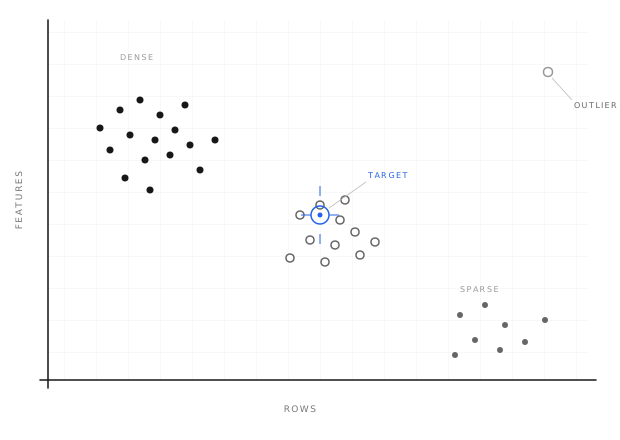
Breast Cancer
Classification
569 rows · 30 features · target: diagnosis
Digits
Classification
1,797 rows · 64 features · target: digit
Titanic
Classification
1,309 rows · 6 features · target: survived
Heart Disease
Classification
1,025 rows · 7 features · target: target
Penguins
Classification
342 rows · 2 features · target: species
Iris
Classification
150 rows · 4 features · target: species
+ 19 more in the visualizer
Resources
Learn the ideas behind the visuals.
- Machine Learning
- Linear Algebra
- Probability
- Statistics
- Model Evaluation
- Feature Engineering
Architecture
From dataset to understanding.
Follow an experiment from configuration through real model computation to visual insight. Documented like infrastructure, not marketing.
REACT · FASTAPI · SCIKIT-LEARN · WEBSOCKET
- 01
Dataset
25 datasets
Real and synthetic datasets, projected to 2D for the canvas.
- 02
Preprocessing
pandas · sklearn
Scaling, encoding, and train/test splits before any fitting.
- 03
Model Engine
38 algorithms
Genuine scikit-learn estimators fit server-side on your data.
- 04
Prediction / Metrics
numpy · scipy
Accuracy, ROC-AUC, R², and silhouette computed from real output.
- 05
Visualization
canvas · three.js
Decision boundaries, training curves, and 3D surfaces rendered live.
- 06
Explanation
first principles
Feature contributions and decision paths in plain language.
Understand the model. Don’t just run it.
Open the visualizer and see the computation happen step by step.
- Real computation
- Open source
- First principles